Elastisys operates security-hardened Kubernetes platforms on EU cloud infrastructure. Doing so has taught us many lessons, and we are giving them away to you, so you can learn how to operate a Kubernetes platform yourself.
This is the second blog post in a series on operating a secure Kubernetes platform. The whole series is found via this tag on our blog. The topic of this post is alerting culture.
Simply put, alerting culture is about defining a way of working with alerts that supports your administrators and platform engineers. Alerts need to be actionable, well-defined in priority, and highly robust.
Read the entire blog post to see why alerting culture is important, an example of how it’s used in practice, why it matters, and its greater context.
Alerting Culture
Alerts are a way for Kubernetes clusters to ask for human attention, either by sending an email, a Slack message or making a phone vibrate.
Why is Alerting Necessary?
Different roles within your organization will see different benefits from alerting. The CEO will see alerts as a tool to avoid disappointed customers. The CISO (Chief Information Security Officer) or DPO (Data Protection Officer - a role legally defined in EU GDPR, roughly equivalent to a CISO) will see alerting as a component of the incident management process. The platform team will see alerting as a confidence boost. Instead of fearing "unknown unknowns", the platform team can determine (by the presence or absence of alerts) the status of the Kubernetes platform.
Alerting Primer
Alerting is tricky. Too much alerting may result in alert fatigue and "crying wolf". Eventually the platform team gets used to ignoring alerts and real downtime risk is around the corner. Too little alerting may result in inability to proactively fix issues which can lead to downtime or security incidents.
Alerts are generally categorized as P1, P2 or P3.
P1 or "Needs Attention Immediately" or "2 AM" Alerts
These alerts are only relevant for 24/7 uptime. As their nickname suggests, these alerts should wake up the platform on-call engineer. Since the rest of the team might be asleep – plus a drowsy platform engineer is not very smart – a clear workflow should highlight precisely what needs to be done. In case of doubt, the platform engineer should be instructed to escalate the issue to the platform team lead or postpone resolution to business hours when more team members are available.
To avoid disturbance, P1 alerts should only be used when downtime or data loss is imminent. Example alerts include "etcd quorum lost", "disk space full" or "PostgreSQL split brain / two primary". Given their disruptive nature, P1 alerts should best be minimized by investing in redundancy and capacity predictions.
Example of an Alert Workflow
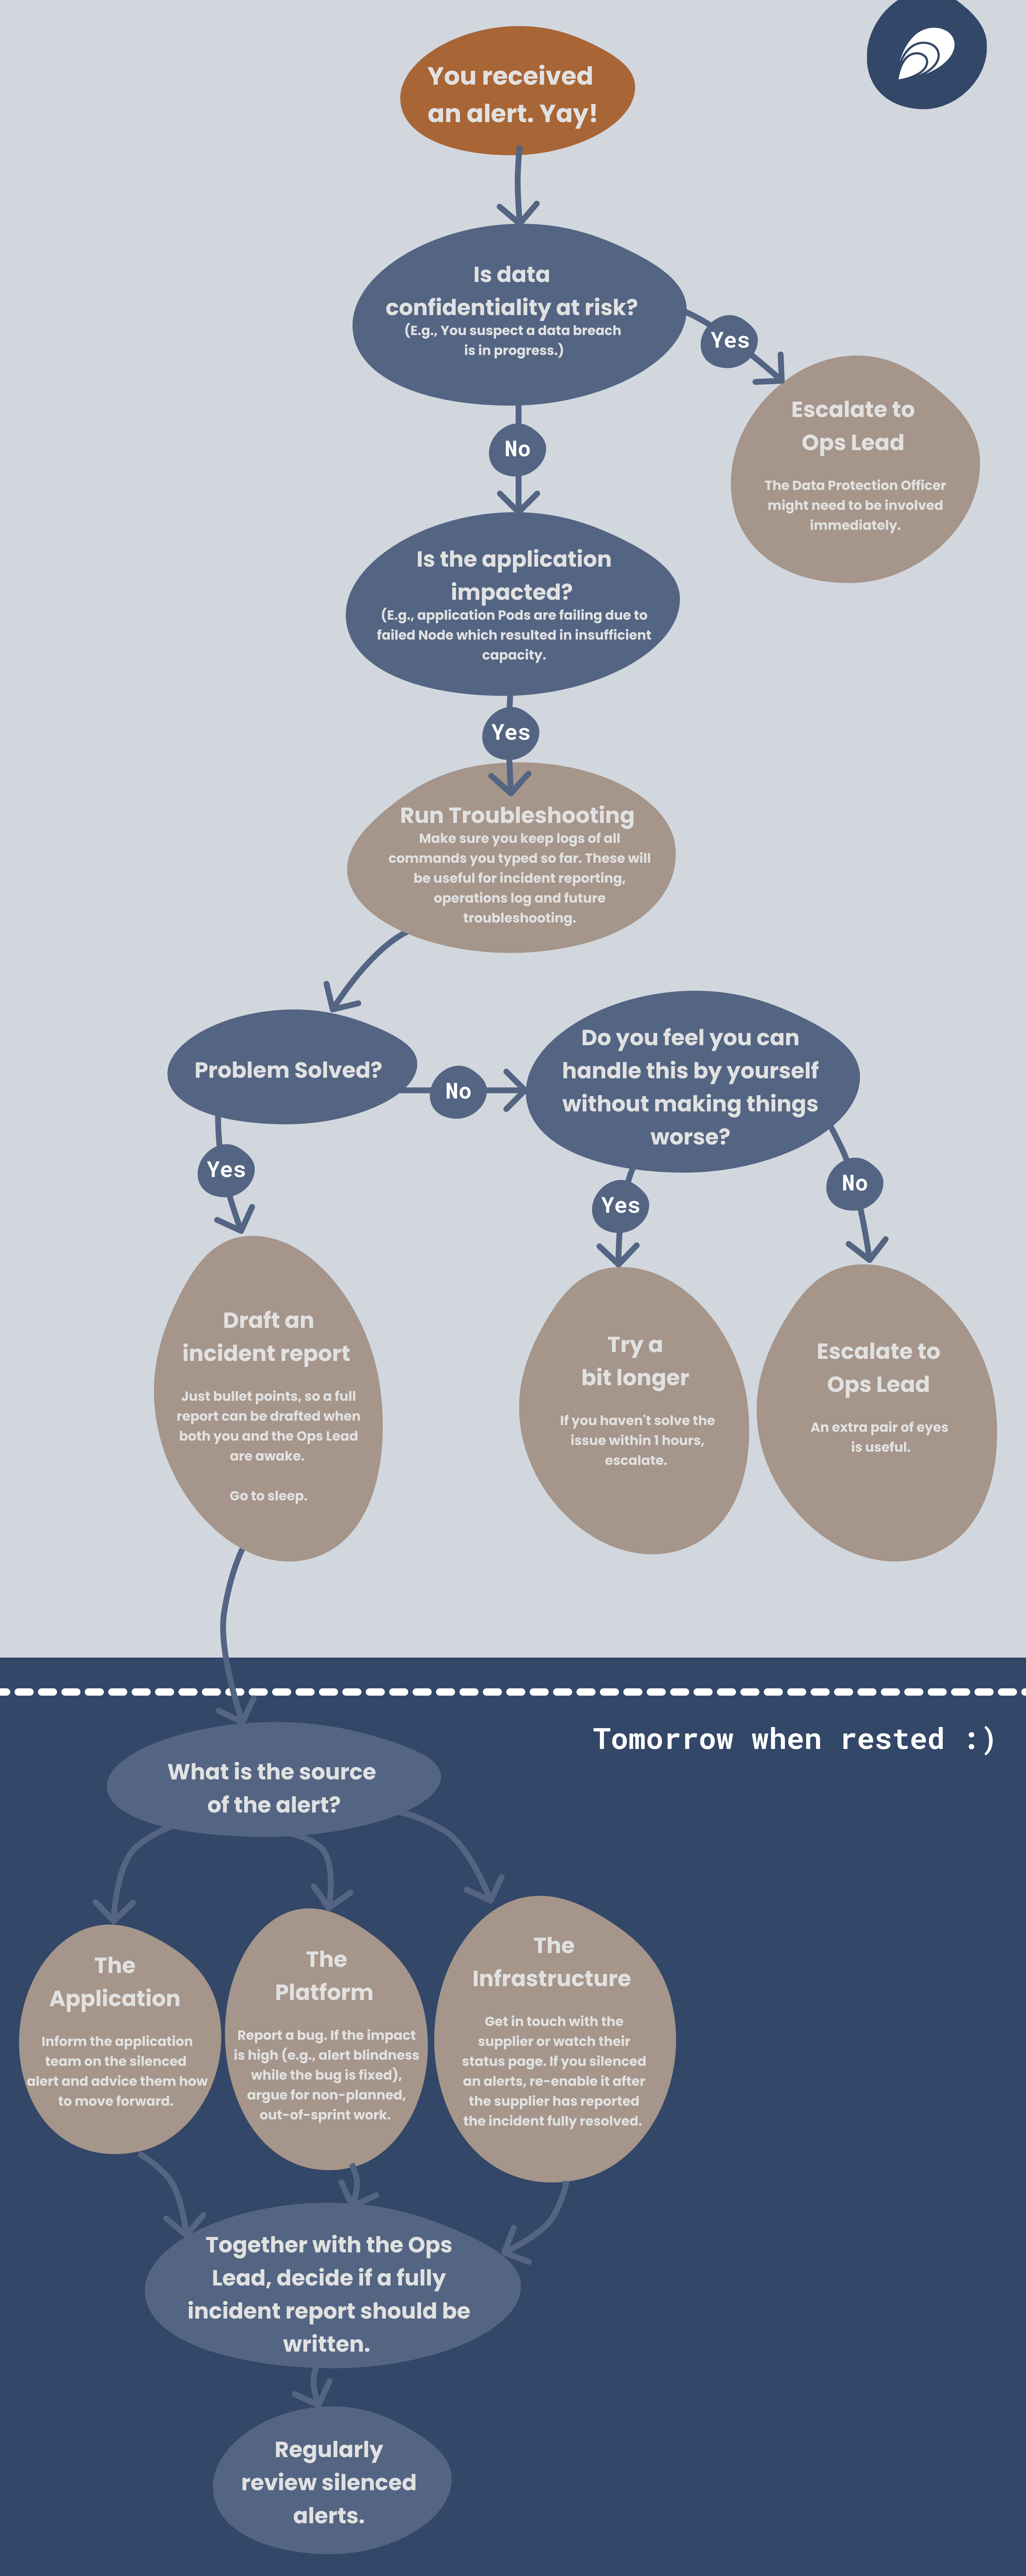
Let us illustrate an example of an alert workflow via the flowchart below. As you can see, the flowchart is composed of two parts: night time and day time. The flowchart includes decisions (blue circles) and actions (gray circles).
Feel free to steal this flowchart and adapt it to your own needs.

P2 or "Needs Attention Within a Business Day" Alerts
These are alerts that only notify a human during business hours. While they do disturb productivity – a person constantly interrupted by alerts will be unable to focus on code writing or improvements – they do not ruin evenings and weekends. Most importantly they do not ruin sleep.
P2 alerts can be taken "slowly" and "smartly" since other platform engineers might be available too. However, make sure to avoid the whole platform team being involved in each and every alert. Ideally, one-or-two members should be handling alerts, while the rest of the team should focus on improvements to reduce the number of future alerts.
Example P2 alerts include:
- Kubernetes Node went down, assuming redundancy ensures no application downtime.
- PersistentVolume will be full within 3 days.
- Host disk will be full within 3 days.
- Cluster will run out of capacity within 3 days.
- PostgreSQL primary failed, secondary promoted to primary.
- Nightly backup failed.
P3 or "Review Regularly" Alerts
P1 and P2 alerts need to be actionable. There needs to be something that the platform engineer can do to fix them, even if that implies escalating to the application team and/or infrastructure team. P3 alerts can be used for all kinds of symptoms that are sporadic in nature, but when looked at over long periods of time, a pattern emerges.
Example P3 alerts include:
- Pods that restart, but only rarely.
- Rare CPU throttling.
- Fluentd log buffer went above a certain threshold.
But How Do I Know if an Alert Should be P1, P2 or P3?
In a nut-shell: engineer for change, not perfection. You are unlikely to get the alerting level right the first time. Even if at some point you reached "alerting Zen", you will want to tune alerting shortly afterwards.
Alerting should be fine-tunable across the Kubernetes platform components and environments. Let me give you an example of alerting categories across the platform components: A cleanup Pod failing might be P3, a backup Pod failing might be P2, while the Ingress Controller Pod failing might be P1.
A similar differentiation is usual across environments: The Ingress Controller Pod failing in a staging environment might be P2, yet the same failure in a production environment might be P1.
Who Watches the Watchers?
A frequent dilemma is what to do in case the alerting infrastructure is down. To avoid this phenomenon, make sure that the alerting system is at least one order of magnitude more resilient than the Kubernetes platform as a whole. Specifically, make sure your alerting components are replicated and allocate them capacity generously.
Furthermore, alerting systems can be configured with "heartbeats": If a heartbeat is not received on time by the on-call management tool, then the on-call engineer is notified.
Metrics-based vs. Log-based Alerting
Alerts may be triggered either based on a condition on a metric or the presence of a log line. We recommend focusing on metrics-based alerting for the following reasons:
- Collecting metrics is cheaper compared to collecting logs.
- Collecting metrics is more robust than collecting logs.
- Metrics can more readily be used for predictions.
How to Build Alerting?
The go-to tools for alerting in a Kubernetes platform are Prometheus and Thanos. Both are CNCF projects, which means they are open source and open governance, hence you avoid the risk of vendor lock-in.
While both Prometheus and Thanos can notify the platform team directly, we recommend using an On-call Management Tool (OMT), such as PagerDuty or OpsGenie. Both integrate well with Prometheus and Thanos. These tools considerably simplify on-call management, e.g., avoid sending P2 alerts during national public holidays. We found the OMTs to be somewhat easier to fine-tune than changing Prometheus configuration. Hence, we took the following architectural decision: Our Kubernetes platform "over alerts" and labels alerts with sufficient information on the Kubernetes platform component and environment. Then, we configure alerting fine-tuning in the on-call management tool.
The diagram on the next page shows how alerting works in Elastisys Compliant Kubernetes.
Your aim should be to bring alerting to a manageable level, not by "sweeping problems under the rug", but by constantly improving platform stability and security, as well as tuning alerting.
So what do you do with a really tricky alert? Next section will discuss how to ensure that your platform team always has an emergency exit.


